Click the Green Editorial Tab Above!
Interest Rates Are Moving Up, How Does That Impact You? by PPCLOAN's Steven Kemper..
2017 Q4
Fourth Quarter 2017 Allstate Agency Value Index
Value Gap Widens between Large and Small Agencies
The pursuit of organic growth has been validated this quarter as the value gap between large and small-sized agencies has widened significantly. The chart below shows agencies with over $3 million in earned premium trading at a multiple of 2.90, while smaller agencies (those with between $1 million and $2 million in earned premium) realized an average sales multiple of just 2.20 times.
| Allstate Agency Price to 12MM Earned Premium Ratio (National Average) | ||||||||||||||||||||||||||||||||||||||||||||||||||||||||||||||||||||||||||||||||||||||||||||||||||||||||||||||||||||||||||||||||||||||||||||||||||||||||||||||||||||||||||||||||||||||||||||||||||||||||||||||||||||||||||||||||||||||||||||||||||||||||||||||||||||||||||||||||||||||||||||||||||||||||||||||||||||||||||||||||||||||||||||||||||||||||||||||||||||||||||||||||||||||||||||||||||||||||||||||||||||||||||||||||||||||||||||||||||||||||||||||||||||||||||||||||||||||||||||||||||||||||||||||||||||||||||||||||||||||||||||||||||||
|
| Use the arrows to see agency values over time. | prev next |
With agencies of $3 million in earned premium or greater selling for a multiple of 2.90 times (.70 times higher than those Allstate agencies with $1 million to $2 million in earned premium) now is as good a time as any to talk about the pursuit of growth and the effects it has on not only the underlying value of your business, but also the amount of income an agency owner can make.
In the section below, my goal is to discuss what I view as the two main residual benefits received when growth of an Allstate agency is realized. I will not discuss the risks and rewards associated with the pursuit of organic growth, nor am I going to discuss the underlying competitiveness of the product being sold, which can be a significant factor in the attainability of growth. It is up to each agency owner to decide to what extent they want to “put the pedal to the metal” with regards to pursuing growth, and hopefully, this section will provide a level of comfort to those looking to take their business to the next level.
The Dual Benefits of Pursing Growth:
- Receive a Higher Sales Multiple as You Grow
If homes in your neighborhood are selling for $100 a square foot and you own a 1,500 square foot house, your house is worth about $150,000. If you doubled your square footage to 3,000 through a residential expansion project, you would still likely still get just $100 per square foot if you sell your house or $300,000. Simple math shows that the value of your house doubled based on your expansion project.
Growth of an Allstate Agency allows you to experience not only an increase in top line revenues, but also an increase in the multiple you can charge for your business. This is significant, as doubling top line revenues results in a more than doubling of the value of the business. Let’s look at an example below:
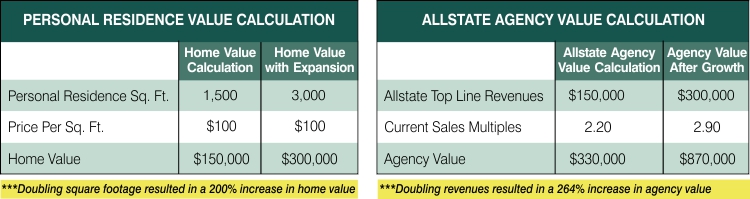
As you can see from the charts above, when you double the square footage of your personal residence, you simply experience a doubling of your residential value. When you double the top line revenues of your Allstate Agency (as was achieved in the example above), you realize an approximate 264% increase in value.
Doubling your revenue, while seeing a 264% increase in agency value is a significant motivator for the pursuit of growth. You aren’t just getting dollar for dollar growth in value, as the market of Allstate Agency purchasers have clearly stated that size matter and that they will pay a higher multiple for a business with more substantial renewal revenue income.
- Make More Money
Economies of Scale – “A proportionate saving in costs gained by an increased level of production.” State another way, growth results in more profit.
When an Allstate Agency Owner is able to grow their top line revenues more often than not the agency owner will experience greater amounts of free cash flow. More income in the pocket of the Agency Owner is a great thing, and is the greatest contributor to growth in value.
$0 to $100,000 in New/Renewal Commission
All agencies financed in this size group by PPC LOAN in the Fourth Quarter of 2017 were part of a merger transaction.
$100,000 to $200,000 in New/Renewal Commission
For the second quarter in a row, 33% of the agencies in this size group were part of a merger transaction. Unfortunately, the average sales multiple for this group dropped in the fourth quarter to 2.20 (well below the multiple of 2.43 realized last quarter). Outside buyers who were awarded the opportunity to reach “scale” through a merger of multiple smaller-sized agencies have historically paid a higher multiple. However, during the final quarter of the year, those outside buyers were able to negotiate a favorable purchase multiple as part of a merger transaction.
$200,000 to $300,000 in New/Renewal Commission
44% of Allstate agencies transitioned this quarter had earned premium ranging from $2 million to $3 million, a significant uptick from last quarter when this size group only represented 21% of agencies sold. The average multiple for these sized agencies was slightly down at a multiple of 2.29 (the multiple was 2.45 last quarter). Further analysis of this size group shows three items that likely contributed to the decrease in value this fourth quarter:
- Outside buyers negotiated favorable deals:
In fact, multiple outside buyers were able to negotiate a purchase multiple of less than 2.0 during the final quarter of the year, which certainly contributed to reducing the simple average for this size group to 2.29. - No merger transactions:
Historically, merger activity has resulted in higher sales multiples, and an absence of mergers this quarter for this size group may have factored into the reduced multiple. - No existing agency purchasers:
In previous quarters, existing agents have paid a much higher multiple than outside buyers for books of this size. The absence of existing agents executing a purchase has likely affected agency values for this size group.
$300,000+ in New/Renewal Commission
In the first quarter of 2017, Allstate agencies in this size group realized a five-quarter high, trading at an average sales multiple of 2.82. This quarter the largest sized agency group exceeded this multiple, realizing an average sales multiple of 2.90. Driving this uptick in value is multiple agencies with over $5 million in earned premium receiving a sales multiple greater than 3.0 times.
| Percentage of Agency Sales by Size Group | |||||||||||||||||||||||||||||||||||||||||||||||||||||||||||||||||||||||||||||||||||||||||||||||||||||||||||||||||||||||||||||||||||||||||||||||||||||||||||||||||||||||||||||||||||||||||||||||||||||||||||||||||||||||||||||||||||
|
| Use the arrows to see agency values over time. | prev next |
The Allstate buy/sell market in the fourth quarter of 2017 was dominated by agencies with over $2 million in earned premium, with agencies of this size representing 72% of agencies sold.
| Allstate Agency Value Ratios | |||||||||||||||||||||||||||||||||||||||||||||||||||||||||||||||||||||||||||||||||||||||||||||||||||||||||||||||||||||||||||||||||||||||||
|
| Use the arrows to see agency values over time. | prev next |
For those agency owners residing in a state where a good portion of the homeowners insurance is written through a third party brokerage company (primarily coastal counties), looking at the multiple of revenues may be your best measuring stick for agency value as it takes into consideration both Allstate and brokered (i.e. non-Allstate) revenues. Certainly, the brokerage book is a reliable source of renewal income and has a level of value that is not presented in the traditional multiple applicable to Allstate commissions.

