Click the Green Editorial Tab Above!
Interest Rates Are Moving Up, How Does That Impact You? by PPCLOAN's Steven Kemper..
2016 Q4
Fourth Quarter 2016
2016 – Great Year for Allstate Agency Values
Allstate Agency Values wrapped up a strong 2016, with the Simple Average hitting 2.57 times in the Fourth Quarter. Mergers continue to be an option for Outside Buyers in the Fourth Quarter, although at a slightly lower rate than the Third Quarter of 2016. Additionally, Existing Agency Owners continued to participate in the acquisition process, representing 13% of all purchasers in the Fourth Quarter.
| Allstate Agency Price to 12MM Earned Premium Ratio (National Average) | ||||||||||||||||||||||||||||||||||||||||||||||||||||||||||||||||||||||||||||||||||||||||||||||||||||||||||||||||||||||||||||||||||||||||||||||||||||||||||||||||||||||||||||||||||||||||||||||||||||||||||||||||||||||||||||||||||||||||||||||||||||||||||||||||||||||||||||||||||||||||||||||||||||||||||||||||||||||||||||||||||||||||||||||||||||||||||||||||||||||||||||||||||||||||||||||||||||||||||||||||||||||||||||||||||||||||||||||||||||||||||||||||||||||||||||||||||||||||||||||||||
|
| Use the arrows to see agency values over time. | prev next |
Allstate New Jersey 2016 Values
The AAVI gave an overview of agency values specific to New Jersey at the end of 2015, and since PPC LOAN has been involved in quite a few New Jersey transactions in 2016, we have enough data to release these updated statistics for 2016. First, it is important to note that Allstate New Jersey is a separate company from Allstate Insurance, and that Agents have a compensation model which pays a base commission rate of 6.5% with an opportunity to make well over 10%.
Below is an overview of the characteristics of New Jersey Agencies PPC LOAN financed in 2016:
- Average 12 Month Moving Earned Premiums = $4,177,309
- 12 Month Renewal Commission Income = $422,389
- Average Commission Percentage = 10.1%
- Average Sales Price = $848,000
- Sales Multiple of Renewal Commission Revenues = 2.01X
In general, New Jersey agencies are very profitable to the owner due primarily to large average customer premiums. The sales multiples in New Jersey are below what we see in the rest of the country, and this is primarily due to the wide range commission scale which starts at a base compensation of 6.5%. The sales multiples in New Jersey clearly back the theory that guaranteed renewal income holds a greater value over contingent or transactional compensation.
Allstate Agencies – Why so Valuable?
With Allstate Agencies experiencing strong values in 2016, this is as good a time as any to reflect on why Allstate Agencies are so valuable. The value Allstate Agencies receive is very unique compared to their peers in other service sector industries (see chart below), and those who have been successful as a captive agent at Allstate Insurance have been rewarded nicely. Let’s take a quick look at some of the driving factors as to why Allstate agencies are so valuable:
- Renewal Income
Those in the personal mortgage origination business receive a single commission check at the time of their customer’s loan closing and no additional residual income is received. When they wake up the morning after a closing, they have to start from scratch and do it all over again. For businesses without renewal income, a single bad month or quarter can be disastrous. Entrepreneurs prefer the reliability that renewal Income affords a business owner, as well as the challenge associated with trying to grow the businesses renewal income base. In fact, renewal income is essential for creating enterprise value and is the number one driving factor as to why Allstate agencies sell for such a high multiple of revenue. - Cash Flow / High Profit Margin
According to BusinessWeek, Outpatient Care Centers’ net profit margin is 12.1%, child care services net a whopping 10.4%, and Lumber Wholesale’s profit margin is on average is 1.7%. To generate $1,000,000 in revenues, but only net $17,000, is like watching a movie with a thrilling beginning and a horrible ending. Certainly, Allstate Agencies yield a much higher bottom line than these aforementioned businesses, something that highly contributes to the large multiple of revenues value received at the time of sale. - Selling a Base Need/Inelastic Product
The value of selling a base need product shines in a down economy as discretionary spending decreases. During this time, many businesses selling “want-based” items suffer while those selling “need-based” items do not (at least not as much). The ultimate base need product is one that consumers are required to purchase – such as insurance. Selling an inelastic product is to own a business that is moderately affected by the ups and downs of the economy. - Devoid of Large Capital Expenditure
Capital expenditure is the ongoing upgrade of physical assets for the business. Almost every small business has some form of ongoing capital expenditures. Owners of cleaning companies, medical practices, and restaurants have to regularly replace very costly equipment. Capital expenditures reduce free cash flow and thus, many savvy investors avoid industries with high CAPEX. Outside the occasional computer purchase, Allstate agencies have little to no ongoing Capital Expenditures. - No A/R or Inventory Management
What a hassle for your average medical professional, having to dedicate staff solely to collect on overdue accounts receivable. Allstate agents also avoid the sometimes dreaded hassle of having to manage inventory, specifically perishable inventory associated with restaurant businesses. - Available Resources
You may be able to make it across the Atlantic in a homemade raft, but it would make a lot more sense to leverage resources that may be available to you such as a large boat, navigation system, weather information, and plenty of food. There are many business endeavors that are akin to building your own boat and then trying to take it overseas. This fruitless expenditure of effort may be avoided by placing yourself in a business that provides you with substantial resources to increase your likelihood of success. Allstate agency ownership is the perfect example of an abundance of resources available to agents, all of which assist the business owner from having to re-create the wheel.
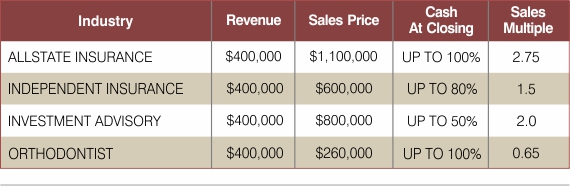
As mentioned above, the following chart illustrates Allstate Agencies’ superior values compared to those of other major industries where an organized buy/sell market exists. Being an Allstate Owner has many traits that separate itself from other business opportunities, however; when it comes to business valuations, the proof is in the pudding.
| Percentage of Agency Sales by Size Group | |||||||||||||||||||||||||||||||||||||||||||||||||||||||||||||||||||||||||||||||||||||||||||||||||||||||||||||||||||||||||||||||||||||||||||||||||||||||||||||||||||||||||||||||||||||||||||||||||||||||||||||||
|
| Use the arrows to see agency values over time. | prev next |
The Buy/Sell market in the Fourth Quarter of 2016 was dominated by agencies with over $2 million in Premium, with agencies over $3 Million in Premium representing 57% of agencies sold.
| Allstate Agency Value Ratios | |||||||||||||||||||||||||||||||||||||||||||||||||||||||||||||||||||||||||||||||||||||||||||||||||||||||||||||||||||||||||||||
|
| Use the arrows to see agency values over time. | prev next |
For those Agency Owners residing in a state where a good portion of the homeowners insurance is written through a third party brokerage company (primarily coastal counties), looking at the multiple of revenues may be your best measuring stick for agency value as it takes into consideration both Allstate and brokered (i.e. non-Allstate) revenues. Certainly, the brokerage book is a reliable source of renewal income and has a level of value that is not presented in the traditional multiple applicable to Allstate commissions.


