Being the creator and author of the Allstate Agency Value Index has afforded me the opportunity to write countless articles and to travel on behalf of PPC LOAN to speak to both Allstate Management and the Agency force. Recently, I spoke at a highly attended succession planning meeting for the California Region, which gave me the opportunity to share and receive knowledge on how Allstate Agents can best prepare for the eventual transition of their business.
As a business owner myself, I know the importance of empowering employees to make decisions and take initiative on behalf of the company. These opportunities will yield happier workers who are more productive.
That having been said, I would like to congratulate Eric LeBlanc from PPC LOAN for writing this Quarters Editorial entitled "What Makes Allstate Special?" Eric asked for the opportunity to expand on an article I previously wrote comparing the State Farm, Allstate and Independent Insurance agency opportunities from an owner's perspective. I hope you enjoy.
Paul Clarke
President
PPC LOAN
What Makes Allstate Special?
Paul previously wrote an article comparing the Insurance Agent opportunities offered by Allstate Insurance, State Farm Insurance and Independent Insurance, from an agency Principal's perspective. He concluded many things from his research with the main conclusion being that Allstate Insurance is a pretty darn good entrepreneurial opportunity. It's profitable, it's easy to get in and out of, and the agencies are very valuable.
In that article, Paul didn't answer one question: Why are Allstate Agencies so valuable?
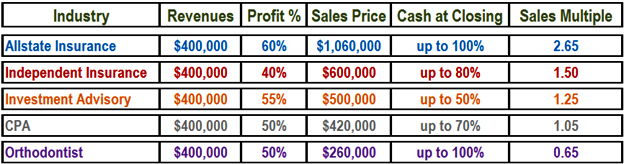
Why do buyer's flock to these small businesses and pay what other small business owners in other industries would consider a premium? The chart below illustrates an Allstate Agency's superior value compared to other typical small business opportunities.
In this article, I will try to answer the question – "What makes Allstate special?" To do so, I've listed what I think are the top ten characteristics (in no particular order) that I believe most savvy entrepreneurs would desire when looking to invest in a business opportunity.
1. Low Government Intervention
Government regulation is very necessary, however; excessive regulation can cause great strain on a business's ability to prosper or even survive (especially small business). Just ask any Owner / employee of a small bank around the country. Due to the Dodd Frank Bill, banking is not fun right now, nor is it very easy to make a profit. Ideally, an entrepreneur would desire a business model that is devoid of stringent government intervention, giving them the freedom to steer the direction of their business.
2. Selling a Base Need/Inelastic Product
The value of selling a base need product shines in a down economy as discretionary spending decreases. During this time, many businesses selling "want-based" items suffer while those selling "need-based" items do not (at least not as much). Moreover, a base need product will always be in demand as opposed to those that are seasonal. The ultimate base need product is one that consumers are required to purchase – such as insurance. Being an entrepreneur, I would prefer a business that sells a product moderately affected by the ups and downs of the economy.
3. High Profit Margin
According to BusinessWeek, Outpatient Care Centers net profit margin is 12.1%, child care services net a whopping 10.4%, and Lumber Wholesale's profit margin is on average is 1.7%. To generate $1,000,000 in revenues, but only net $17,000, is like watching a movie with a thrilling beginning and a horrible ending. Entrepreneurs are in business to make money and have a high appreciation for those businesses with a healthy bottom line.
4. Devoid of Large Capital Expenditures (CAPEX)
Capital expenditure is the ongoing upgrade of physical assets for the business. Almost every small business has some form of ongoing capital expenditures. Owners of cleaning companies, medical practices, and restaurants have to regularly replace very costly equipment. Steel companies use a great percentage of their profits to purchase new furnaces. Capital expenditures reduce free cash flow and thus many savvy investors avoid industries with high CAPEX. All things being equal, entrepreneurs would prefer to avoid those businesses that require large cash outlays (CAPEX) to simply keep things going.
5. Renewal Income
Those in the personal mortgage origination business receive a single commission check at the time of their customer's loan closing and no additional residual income is received. When they wake up the morning after a closing, they have to start from scratch and do it all over again. For businesses without renewal income, a single bad month can be disastrous. Entrepreneurs prefer the reliability that renewal Income affords a business owner, as well as the challenge associated with trying to grow the businesses renewal income base. Many would argue that renewal income is essential to creating enterprise value.
6. No Accounts Receivable Management
What a hassle for your average dentist. Most dentists only staff five to six employees, with one being devoted to A/R collection. This is a drag on profitability. Entrepreneurs would prefer a business where they do not have to chase down their customers for payment.
7. Passive Management
As the author of "Rich Dad Poor Dad" stated, you are not truly rich until your monthly passive income exceeds you monthly expenditures. The ideal income stream is one that comes without any invested energy on your part. To the extent that an income stream demands your time and energy, it becomes a poorer investment. The small business owner who earns $100,000 per year but works 100 hours per week (which is excessive but is the reality for some) is only making approximately $20 per hour – while the owner who has a "four hour work week" earning the same amount is making approximately $500 per hour. Take home pay is not the only measuring stick of what makes a business opportunity valuable – I would argue that time commitment is a bigger factor. Entrepreneurs will view an investment opportunity including the risk reward pay-off as it related to their most valuable asset – their time.
8. Ease of Transferability
You have decided to sell your business to relocate to your home town to care for your ailing parent. However, finding a buyer and getting all your ducks in a row is a process that typically takes up to 12 months and is ideally done over the course of many years (i.e. an associate is hired, trained, and buys into your business over the years). Unfortunately, you have to leave in the next two months which forces you to sell your business for a discount. Entrepreneurs want a business that is in high demand, and they want to be able to easily transition their business to another owner when desired.
9. True Ownership
Many franchises across many different industries allow an individual to be an owner of the business in every way except actually owning the asset. They have the "privilege" of being responsible for all aspects of business ownership such as hiring and firing, marketing, budgeting, casting vision for the particular entity, etc.; but when it comes time to exit, they are forced to return the asset they built to the company that allowed them to build it. Entrepreneurs want a business that provides a true return on their investment at the time they decide to exit the business, which is typically realized in the opportunity to sell their business in the open market for top dollar.
10. Available Resources
You may be able to make it across the Atlantic in a homemade raft, but it would make a lot more sense to leverage resources that may be available to you such as a large boat, navigation system, weather information, and plenty of food. There are many business endeavors that are akin to building your own boat and then trying to take it oversees. This fruitless expenditure of effort may be avoided by placing yourself in a business that provides you with substantial resources to increase your likelihood of success. Entrepreneurs can appreciate a business that has a strong support network and doesn't require the business owner re-creating the wheel.
Now that we have discussed various characteristics of desirable business opportunities, I am going to grade (on a scale of A through F), the Allstate Exclusive Agent Opportunity based on each attribute:
Low Government Intervention -
B
When looking at Allstate, government intervention is very low for the individual agency owner. The government has enacted new health care reform through the Affordable Health Care Act, which has not affected those in the property and casualty business (like Allstate Insurance). There are, however, some instances where the government does affect the individual owner such as the moratorium on homeowners' insurance premiums that was placed on some insurance carriers, including Allstate, affected by Hurricane Sandy. Given the fact that, for the most part, the government does not consistently interfere with day-to-day business, I would rank this aspect of the Allstate opportunity with a B.
Selling a Base Need/Inelastic Product -
A+
Given that every state in the U.S., with the exception of Mississippi, New Hampshire, and Virginia, has compulsory insurance laws, I would say that auto insurance has become a base need product since the 1960's and 1970's when the majority of the states began passing these laws. Additionally, homeowners insurance is more or less a base need for homeowners (which comprise nearly 70% of Americans), since mortgage lenders require it for the duration of a mortgage being in place. Given that Allstate's main source of business is derived from selling Property and Casualty insurance, I would give the Allstate opportunity an A+ in terms of selling a base need product.
High Profit Margin -
A+
Few businesses have an average profit margin in excess of 50%, something Allstate Insurance agents can proudly boast. For the average Allstate agency owner, overhead (not including owner wage or debt service), runs between 35% and 45%. This translates into significant take home pay for the Agency owner. This model allows the owner to build wealth over the course of time rather than waiting to get a big payout at the date of sale. Given that most agents earn approximately $0.60 cents on every dollar earned, I would give the Allstate opportunity an A+ in this category.
Devoid of Large Capital Expenditures (CAPEX) -
A
Besides a relatively low cost technology upgrade every few years and possibly bringing the office space to meet the Branded Retail Environment standard, Allstate agency ownership does not require a large amount of ongoing capital expenditures. This is a far cry from many other small businesses that require expensive medical equipment or machinery to accomplish the task. Given the small amount of capital required, I have given the Allstate opportunity an A.
Renewal Income -
A+
If an Agent is maintaining the agency at a steady level of earned premiums and has a retention ratio of 87%, this means that 87% of the income generated by the Agency is in the form of renewal commissions. Sure, existing customers must be taken care of and given excellent service, but that is the easy part. It is much harder to make a new friend than to keep an old one. This aspect of the Allstate opportunity is very desirable and deserves an A+ rating.
No Accounts Receivable Management -
A
Like clockwork, insurance premiums are received each year or bi-annually and are paid directly to Allstate Insurance. Given the relative ease of collecting payments, I have rated this category with an A.
Passive Management -
D
The Allstate opportunity varies widely from hands-on employee-owners to remotely-managing absentee owners (who are ever-present in many ways). Though Allstate agents have the ability to create their own job title, the vast majority of agents who operate a well-run shop are very hands on. These agents are the face of their agency – they are shaking hands in the community, sponsoring local sports teams, involving themselves in community civic organizations, etc. They make themselves known and open their schedules for interruptions. In addition to business generation efforts, successful Allstate agents have a solid understanding and awareness of the internal operations of their Agency. They consistently hold staff meetings, maintain close contact with key employees, monitor production, set goals, motivate staff, create and implement marketing initiatives, keep a close watch on external economic and industry-specific events, etc. They immerse themselves in the intricacies of agency operations. Given the dedication and time commitment required to operate a successful Allstate agency, with the exception of a minority of absentee owners, I give this category a D. Though passive management is ideal, it does not follow that active management is a bad thing. Allstate agency ownership is, for the majority of agents, their primary source of income – and we all must work to eat. Moreover, actively running their agency provides the agent with the gratification of getting to know and serve their community which many would argue is one of the most rewarding investments you can make.
Ease of Transferability -
B
When looking at Allstate, government intervention is very low for the individual agency owner. The government has enacted new health care reform through the Affordable Health Care Act, which has not affected those in the property and casualty business (like Allstate Insurance). There are, however, some instances where the government does affect the individual owner such as the moratorium on homeowners' insurance premiums that was placed on some insurance carriers, including Allstate, affected by Hurricane Sandy. Given the fact that, for the most part, the government does not consistently interfere with day-to-day business, I would rank this aspect of the Allstate opportunity with a B.
True Ownership -
B
Allstate Agents have the opportunity to sell their agencies when they choose to end their career with Allstate and have realized substantial sales multiples for well in excess of a decade. Despite this positive, a grade of B was given, as Allstate Insurance does reserve the right to make changes to the Allstate Exclusive Agent opportunity, which could positively or negatively affect values.
Available Resources -
A
From the national advertising campaigns to local management, Allstate offers its agents a myriad of resources aimed to help the individual Agent succeed. The majority of small business owners do not have the ability to call on a manager with common interests and greater depth of experience, nor do they have Good Hands catching every college football field goal or Mayhem commercials to joke about with friends. I have given the Allstate opportunity an A in terms of resources available to help the agent succeed.
The Allstate Insurance Agency business model is built for success, and beyond just the attributes above, has the necessary characteristics to make the opportunity additionally attractive to lenders. Overall the Allstate Exclusive Agent opportunity, when considered through the lens of my top ten characteristics of a small business, would receive an A, making it at or near the top of the list for business opportunities in the country.