Click the Green Editorial Tab Above!
Interest Rates Are Moving Up, How Does That Impact You? by PPCLOAN's Steven Kemper..
2011 Q4
2011 Year Review
In 2011 there were many active topics of discussion in the Allstate Community. Agency Terminations, Mergers and Acquisitions, Esurance along with the hottest of all topics: Variable Compensation.
Variable Compensation and Agency Values
The biggest question I continue to be asked is “How will Variable Compensation affect agency values?”
The short answer to this question revolves around Allstate Insurance’s recent announcement that base pay for agents will be 9% in 2013 and 2014, instead of the originally proposed 8% base commission rate. This smaller than anticipated reduction in base commission matched with attainable incentives for getting back to a 10% commission rate will likely result in a marginal change in agency values, if any.
If you are like me the short answer doesn’t quite satisfy your curiosity. In digging deeper I think it is appropriate to look at how the market of buyers and sellers currently formulate an agreed upon price for an Allstate Agency. Then we can try to determine if and how Variable Compensation might affect the future value of Allstate Agencies.
In the Allstate world, the market of free-will Buyers and Sellers of Allstate Agencies have spoken loud and clear that Fixed Compensation holds a far superior value to variable compensation or bonus income. This makes sense under the current compensation structure as the requirements to hit a bonus change on an annual basis, with the one constant in an Allstate agency being 10% renewal commission income. In fact, bonus and other contingent income are not even part of the equation when discussions of price arise – I’ll support this theory with an everyday example:
If an agent calls me up and tells me they are selling their $3,000,000 agency for 2.5 times, without additional inquiry, I know the purchase price is $750,000:
$3,000,000 Earned Premium X 10% base commission X 2.5 Multiple = $750,000 Sales Price
In this situation, the revenue of the agency may have been $340,000+, with the inclusion of bonus and other miscellaneous income, however, this additional income is not included in the equation used to determine the final sales price.
For comparison purposes, let’s look at the housing market, where price per square foot is the rule of thumb that drives the price. Everyone wants to know what homes in their neighborhood are selling for on a per square foot basis. However, we all know that not all houses in a given neighborhood are created equally, since some have a more desirable floor plan, a bigger lot, or a pool. Yet, in any neighborhood, these “perks” rarely result in a top quality house selling for a significant amount over the going market price per square foot.
Allstate Agencies tend to realize the same restrictions with regard to potential sales price. Yes, an agency that is growing and has a good retention ratio will sell for more than an agency with poorer performance. However, the additional reward for an exceptional agency is minimal at the time of sale. Simply stated, my $3,000,000 Earned Premium Agency will never sell for 2 or 3 times more than another Agency with the same Earned Premium. There may be a small additional benefit at closing for an agency that is likely to receive a big bonus and thrive under the new variable compensation program; however, any reward for running an exceptional agency must be realized by the owner during the time of ownership.
The absence of wild variations in the multiple for which Allstate Agencies sell is due to simple economic limitations. Regardless of how well a $3,000,000 Agency performs in a given year, there is only so much cash flow available to support overhead, a wage to the owner and debt service associated with a purchase. Buyers simply cannot justify a purchase at a higher multiple, as it does not make economic sense.
One cannot manage change. One can only be ahead of it. – Peter Drucker
I’ll conclude the Variable Compensation discussion with two notes:
- I have a hard time envisioning any scenario where variable income will hold an equal or similar value to fixed/renewal income. The bottom line is not all dollars are created equally. Those commission dollars that are guaranteed will be superior in value to those earned on a contingency basis.
- I see Variable Compensation as an opportunity. An opportunity vetted in greater income potential, but absent an opportunity to realize a greater price multiple that is in step with the efforts it took to create this additional income. Therefore, anyone buying into this line of thinking would be wise to create a fiscal environment in their business that has a healthy mix of business spending, personal spending and retirement savings. Don’t put all your eggs in the future sale of your agency. From a time value of money perspective we all know a dollar saved today is more valuable than a dollar saved 20 years from now.
In times of rapid change, experience could be your worst enemy. J. Paul Getty
Mergers
Agency values in 2011 were affected in part by the allowance of merger transactions by Allstate Corporate.
Historically, choices were limited in their immediate geographic area for those who wanted to purchase an agency of $3M or more in premium. Often, those agents desiring to buy a larger sized Allstate Agency ultimately settled for purchasing a smaller agency or investing in a start-up because organic growth was the only way to achieve their goal.
2011 presented a unique opportunity for both Outside Buyers and Existing Agency owners alike, as they were able to achieve scale by acquiring existing small or medium sized agencies that were purchased and merged. When you add the larger agencies available for sale, along with these merger opportunities, the market was suddenly saturated with opportunities to “get big” in a single transaction. This kind of opportunity has not been seen or realized since 2000 / 2001.
PPC LOAN was involved in over 200 agency transitions in 2011 and we saw this phenomenon first hand. Just over 70% of the agencies PPC LOAN was asked to finance were part of a merger transaction. Fifty-five percent of merger transactions were for Outside Buyers, with the remaining 45% going to Existing Agents who were allowed to purchase and merge their way to scale (again, a departure from historical expectations that growth should be primarily accomplished organically).
Allstate continues to work to attract new owners to the agency force. Sixty-eight percent of PPC LOAN’s agency financing transactions were to Outside Buyers, with 40% of those Outside Buyers buying a single agency location and the other 60% being allowed to purchase and merger multiple books (2-4 agencies).
| Allstate Agency Price to 12MM Earned Premium Ratio (National Average) | ||||||||||||||||||||||||||||||||||||||||||||||||||||||||||||||||||||||||||||||||||||||||||||||||||||||||||||||||||||||||||||||||||||||||||||||||||||||||||||||||||||||||||||||||||||||||||||||||||||||||||||||||||||||||||||||||||||||||
|
| Use the arrows to see agency values over time. | prev next |
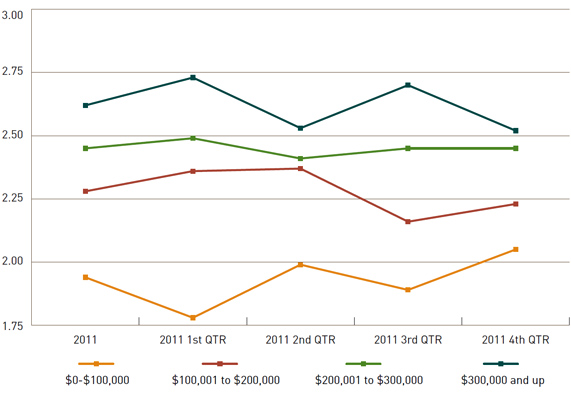
| Allstate Agency Value Ratios | |||||||||||||||||||||||||||||||||||||||||||||||||||||||||||||||||
|
| Use the arrows to see agency values over time. | prev next |