2011 Q3
Third Quarter 2011
VARIABLE COMPENSATION – “GO BIG OR GO HOME”
The prevailing question of the day is “How will Variable Compensation affect the income of Allstate Agencies and thus their Agency Values?” To answer this question, it is imperative that a clear understanding of just what is required for an agency owner to get from the new 8% commission base back to the historic base of 10%. If agency owners are required to spend additional time and money getting to and staying at the 10% commission level, agency values will have been diminished. Conversely, if the 10% commission level is realized with little or no expenditure of additional time or money, agency values should remain, at a minimum, flat.
Allstate is on a mission to have more agencies achieve “Scale”, currently defined as having $3,000,000 or greater in Earned Premium. As a result of Allstate’s effort to increase the number of larger agencies within its ranks through a historical level of approved agency mergers one could speculate that the Variable Compensation Plan will be teed up for larger agents to make a greater commission percentage than smaller agency owners. In support of this view, a recent article quoted Tom Wilson as saying, “Smaller agencies can’t support the kind of support staff you need, you can’t have the broad product knowledge you need, so you’re going to have trouble being an expert.” He went on to say, “You have to have enough size and scale and revenue flow to invest in what you need to know.”
Consequently, the new Variable Compensation program is likely to reduce the profitability and value of smaller agencies.
Agency Value
During the third quarter of 2011 a significant surge in Allstate approved agency acquisition/mergers occurred. As noted, this activity is being supported by Allstate and pursued by agency buyers in recognition of the fact that size/scale matter when it comes to individual agency profitability and value. It takes money to make money and smaller agencies find it difficult to both pay their owners a livable wage and effectively invest in growth initiatives.
Realizing that the potential of lower future commission income would be detrimental to their bottom line, smaller agency owners have a window of opportunity to either sell or buy into an agency merger transaction. Ultimately, more have decided to sell and the values realized for their businesses have decreased.
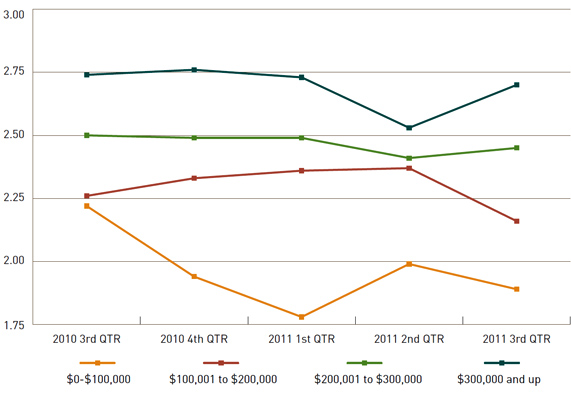
- Agencies with renewal commission income of less than $100,000 realized a decrease in value from 1.99 to 1.89 from the Second to Third Quarters of 2011.
- Agencies with renewal commission income between $100,000 and $200,000 saw their greatest historical decrease dropping from 2.37 times renewal commission in the 2nd Quarter to just 2.16 times in the 3rd Quarter of 2011.
| Allstate Agency Price to 12MM Earned Premium Ratio (National Average) | ||||||||||||||||||||||||||||||||||||||||||||||||||||||||||||||||||||||||||||||||||||||||||||||||||||||||||||||||||||||||||||||||||||||||||||||||||||||||||||||||||||||||||||||||||||||||||||||||||||||||||||||||||||||||||||||
|
| Use the arrows to see agency values over time. | prev next |
Agency Analysis by Size Group
$0 to $100,000 in New/Renewal Commission
For the second straight Quarter, 100% of these smaller agencies were part of a merger transaction, however, a decrease in value was likely driven by various degrees of compulsion to sell. Agency owners in this size group either want to get closer to scale, or sell their agency prior to an expected window of merger activity closing. It has been widely reported by Allstate Insurance that merger activity is occurring at historical levels in 2011, a trend that will certainly reduce at some point in the near future.
$100,000 to $200,000 in New/Renewal CommissionFifty-two percent of the agencies transitioned during the Third Quarter were in this size class. A unique disparity for the Value Index, and hints at these agency owners possibly seeing a short window of opportunity to sell their agency as part of a merger transaction. Undoubtedly, at some point in the future, agencies in this group will be somewhat of an “Ugly Duck” in a world where the majority of agency owners have either achieved Allstate’s version of scale, or are relatively close. Buying this sized agency in the future will likely be unattractive as a stand-alone business amongst the tall trees of $3,000,000+ Premium agencies
$200,000 to $300,000 in New/Renewal CommissionAgency Values appear to be reverting back to their historical level of 2.50, which shows that buyers are willing to pay a strong multiple to purchase an agency near or at Scale. It will be interesting to see where the values of these agencies trend in the future.
$300,000+ in New/Renewal CommissionAgencies in this size group have recovered significantly and ended the Third Quarter at 2.70 times Renewal Commission Income. Since buyers have a preference for larger agencies, this group remains the most valuable. Only time will tell if the current merger activity will result in most Allstate agencies moving into this size group, and what values these Scale sized agencies will maintain in the new world of Variable Compensation.
| Allstate Agency Value Ratios | ||||||||||||||||||||||||||||||||||||||||||||||||||||||||||||||
|
| Use the arrows to see agency values over time. | prev next |