Click the Green Editorial Tab Above!
Interest Rates Are Moving Up, How Does That Impact You? by PPCLOAN's Steven Kemper..
2010 Q3
Third Quarter 2010
As noted in the Second Quarter 2010 Allstate Agency Value Index Report, uncertainty
and negative trends in the US Economy continued, while Allstate Agency Values had
begun to stabilize. As we now reach the end of the third quarter of fiscal 2010,
the reports regarding the US Economy are becoming guardedly optimistic, and it is
becoming very clear that Allstate Agency Values are showing signs of extended stabilization.
Allstate Agency Values – Stabilized
A great percentage of Allstate Agency purchasers today are Outside Buyers. These new Allstate Agents have a significant say in the value of agencies, and what they seem to be saying is loud and clear -they are less likely than ever to buy, based on an Agency’s “potential”. These entrepreneurs want a positive Return on Investment when it comes to acquiring a new agency, however, they have not taken their eye off the ball when it comes to the fairness of the purchase with regards to the current performance of the agency being purchased. New Agents want to know that they can earn a fair wage to support their family, cover the overhead expense of their newly acquired business and pay any loan payments without relying on double-digit growth numbers to realize success.
Outside Buyers as a group appear to be establishing values that may serve as benchmarks for years to come based on what they can afford to pay. “Afford to pay” being defined as an Allstate Agency’s Economic Value based on the historical cash flow. Cash Flow is and always will be the underlying value of an Allstate Agency; however, it is worth noting that not all agencies are created equally. The average Allstate Agency sold for 2.43 times Renewal Commissions in the Third Quarter of 2010, however, some Allstate Agencies sold for much less, or much more, than the average.
The Allstate Agency Value Index represents a nice barometer as to which way agency values are headed. If one chooses to use it in negotiations with a buyer or seller it should be noted that the Value Index is simply a great place to start. Vital Questions buyers tend to ask, which will affect the final price they are willing to pay for an Allstate Agency include:
- What is the Agency Retention Ratio?
- What is the Loss Ratio?
- What is the Overhead Percentage?
- Where is the agency located?
- Is the Agency a turn-key operation or will I, as the new agency owner, have to re-invent the wheel with regards to processes for selling new business and retaining clients?
- What is the Agency’s current performance?
- What are my opportunities for growth?
- Premier Service Agents purchasing and merging a small agency into an existing owned location, or
- An Outside Buyer purchasing and merging multiple small books.
| Allstate Agency Price to 12MM Earned Premium Ratio (National Average) | ||||||||||||||||||||||||||||||||||||||||||||||||||||||||||||||||||||||||||||||||||||||||||||||||||||||||||||||||||||||||||||||||||||||||||||||||||||||||||||||||||||||||||||
|
| Use the arrows to see agency values over time. | prev next |
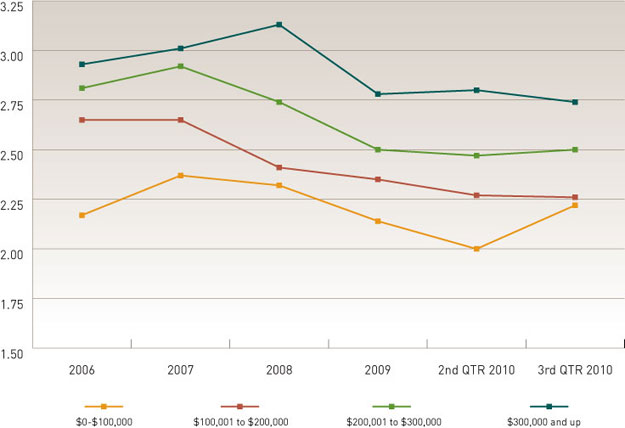
Agency Analysis by Size Group
$0 to $100,000 in Renewal Commissions
A deeper look into the agencies transitioned during the Third Quarter of 2010 in this Size Group reveals an increased number of merger transactions. These mergers were either executed by:
Buyers demonstrated a willingness to pay a seemingly premium amount for this smaller Size Group of agencies due the net effect it had on the bottom line of their overall business.
Existing Agents were obviously incentivized to execute a buy and merge, as their existing agency was likely sufficiently staffed to handle the added premium volume prior to the purchase and merge, and no additional expenditure for rent or other fixed costs were incurred.
Outside Buyers realized similar gains in their purchase, instantly seeing an increase to the bottom line, as more cash flow was now available for growth purposes. An added benefit to Outside Buyers that gave them comfort in paying an average multiple of 2.22 times for smaller agencies, was the instant jump up in Value their merged agency received, as they now owned an agency holding a market value in a larger Size Group.
$100,000 to $200,000 in Renewal Commissions
Agencies in this Size Group continue to maintain a value in excess of 2.25 times
their renewal commission income. It will be interesting to watch the value of agencies
in this Size Group as agency owners strive to achieve the “Ideal Agency Model” status.
$200,000 to $300,000 in Renewal Commissions
As seen in previous releases of the Value Index, Agencies with $200,000 to $300,000
in renewal commission income tend to gravitate towards an average Value of 2.50
times renewal commission income. The Third Quarter of 2010 continues to support
this trend.
Allstate Agencies in this class size tend to have enough free cash flow to invest in new growth opportunities without having to borrow money, thus, taking some of the stress out of a new marketing initiative.
$300,000+ in Renewal Commissions
A further review of Agency Values in this Size Group indicates no glaring explanation
for the decrease in values, which is understandable given the relatively small decrease
that has occurred.
It does appear that the increase in value of smaller agencies may be affecting the value of larger agencies, as more Outside Buyers are opting to purchase and merge multiple smaller agencies instead of purchasing an existing large agency. With the option in some regions to purchase and merge multiple smaller Agencies, Outside Buyers are essentially picking up a larger Allstate Agency on the cheap. Sellers of larger agencies now have competition from not only other large agency sellers, but also two or three small agencies that might be geographically appropriate for a merger.
As always, change is inevitable. Should Allstate Insurance cease allowing the merger
of multiple small agencies to Outside Buyers, it is expected that the value of larger
agencies will quickly increase, since fewer will be available (with the absence
of merged small agencies).
It will be interesting to watch what happens to agencies in this Size Group. These
agencies are desirable, being near, or having already met the desired size requirements
for “Ideal Agency Model” status. The cash flow of these Agencies provides owners
flexibility with regards to investing in growth.
| Allstate Agency Value Ratios | ||||||||||||||||||||||||||||||||||||||||||||||||||
|
| Use the arrows to see agency values over time. | prev next |